When you’ve created a new calculating web page in Excel, you may want to test it already in Excel before you convert and publish it on a server. Here are a few useful tips.
Excel offers a few simple tools to enhance the value of spreadsheets. The Scenario Manager can test the calculator with a number of predefined values. With Goal Seek, you can decide the result you want and have Excel use trial-and-error looking for the perfect input data.
One of the most powerful uses for the Scenario Manager is regression testing, i.e. to ensure that you don’t introduce errors in existing functionality as you develop a complicated calculator. If the output of your formulas is essentially linear, you can probably just throw in a few values and see that the result matches your expectations, but what if the formulas have thresholds that fundamentally change the behavior of the calculator for certain value ranges? As an example, a tax calculation can use very different formulas at various levels of income. In such cases, it’s good to prepare a structured set of values to test with and to know the correct result for each value in advance.
In this example, we have a muffins bakery. At the beginning of the day, we can sell blueberry muffins at full price, with a profit of £1.00. As the day goes on, the muffins become less fresh and people start looking for other products. We then reduce the price, which lowers our profit to £0.40 per muffin.
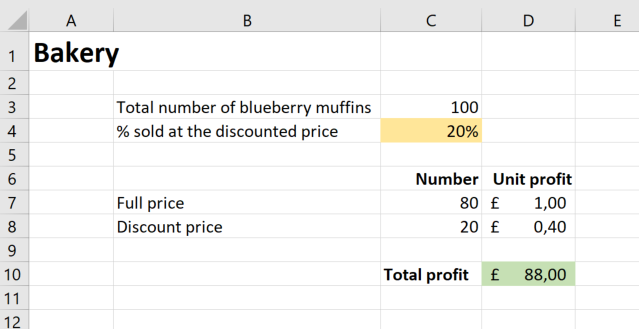
As you can see in the calculation above, if we sell 20% of the muffins at the discount price we have a total profit of £88.00 from blueberry muffins every business day.
Now we want to know how much our total profits from these muffins will decrease if we increase the number that is sold at a discount. To do this what-if analysis, we will use Excel’s Scenario Manager.
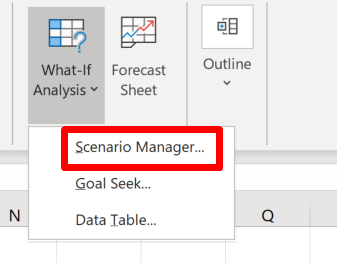
The Scenario Manager is started from the Data section of the ribbon, Forecasts group, What-If Analysis menu.
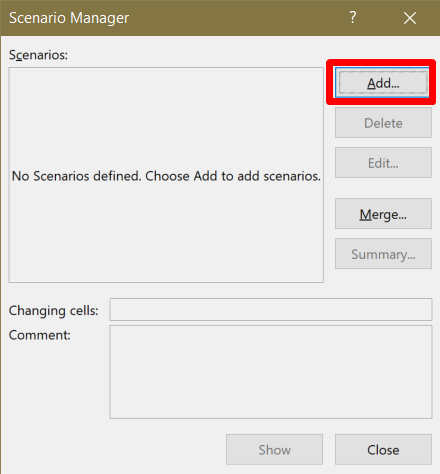
The Scenario Manager window allows you to create the scenarios you want. In our case, we will create five different scenarios with 0%, 5%, 10%, 15%, and 20% of the muffins sold at the discounted price. To add the first of the five scenarios, we click on the Add button in the Scenario Manager window.
We give the scenario a name and select the cell that we want to assign a value to in the scenario.
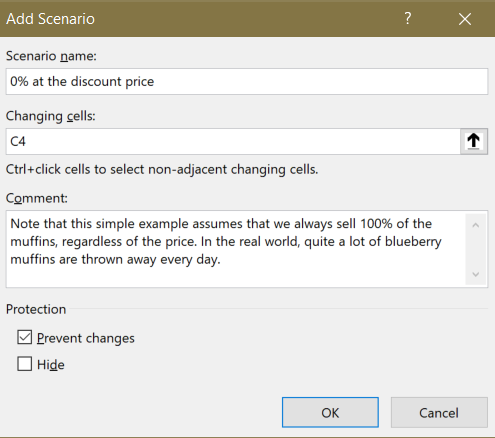
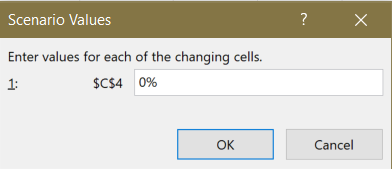
When you press OK, the Scenario Manager wants to know the value to use for the changing cell C4 in the scenario. For this scenario, the value is 0%.
Now repeat these steps to add the scenarios for 5%, 10%, 15%, and 20%.
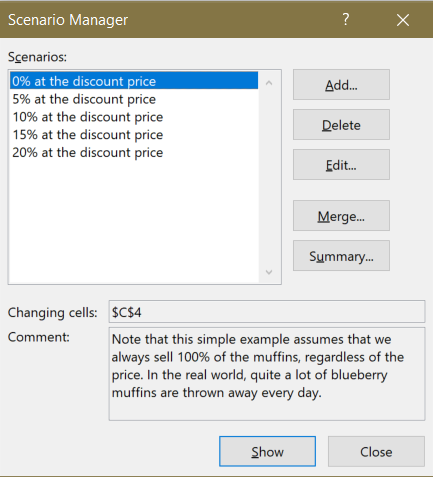
To test the calculator with each scenario, select the scenario in the list and press Show. Excel inserts the corresponding value in C4 and calculates the result.
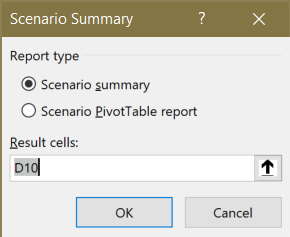
If you want to test all the scenarios simultaneously, click on Summary. Excel asks you which of the cells in the spreadsheet you consider the most important to save for each scenario, the Result cell. In our case, this is the Total profit in D10.
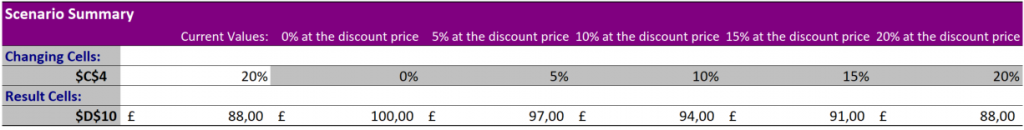
Click OK. Excel inserts the scenario values, one by one into C4, and for each input value, it saves the result value returned in D10. The resulting table is saved as a new worksheet.
You may think that this was much work for something you know several ways to do much quicker. The benefit of using the Scenario Manager is that you can save as many scenarios as you like together with the spreadsheet you want to test. You can perform these tests as often as you like – every time you edit the spreadsheet, if you like – and it takes almost no time. There is hardly any manual work involved even for very extensive testing of the calculator, except during the initial setup.
Simply speaking, Excel’s Goal Seek does the opposite of what the Scenario Manager does. Using trial-and-error, Goal Seek goes directly searching for the perfect value that satisfies your request, without showing you all the values that figured in-between. Like with the Scenario Manager, if the output of your formulas is essentially linear, you can probably just improvise a few values and pretty quickly navigate manually to the result that best matches your expectations.
In the complex world of real life, however, there are lots of situations where a result changes direction and suddenly starts to decrease with higher input values. As an example, this behavior is typical of workload calculations, where total productivity first increases with added load, but then starts to decrease when the subsystem is overloaded. Using Goal Seek, you could immediately find the sweet spot for the subsystem, where productivity cannot be increased further.
Using Goal Seek, we will now ask Excel to use the muffins calculator to find out how many of the muffins we can sell at the discounted price and still make 66% of the maximum profit.
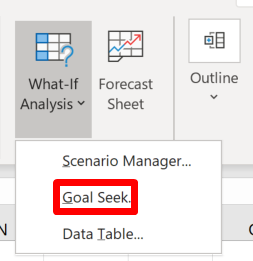
The Goal Seek function is started from the Data section of the ribbon, Forecasts group, What-If Analysis menu.
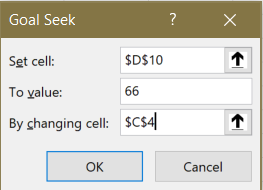
To run Goal Seek, Excel needs to know
Enter these values into the Goal Seek prompt.
Click OK. Excel tries different values in D10 until it reaches the goal value of £66.00 in C4 and then proudly presents the results.
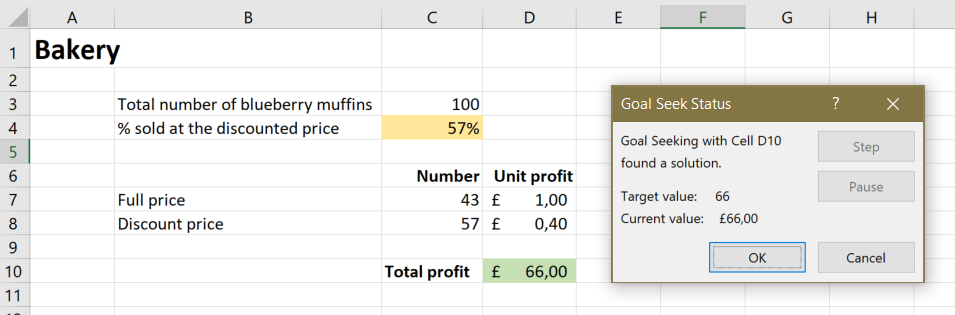
What everybody wants to know now is the input value that gave the goal value as a result. One day, Excel may use the Goal Seek Status window to give us this directly. Until then, we have to look in cell C4 ourselves. We now know that we can sell 57% or more than half of the blueberry muffins at the discounted price, and still make two-thirds of the maximum profit.