Follow these instructions to enable and create interactive charts in Excel spreadsheets converted to web format with SpreadsheetConverter.
If you have a chart in your spreadsheet, SpreadsheetConverter will automatically try to create a similar chart in the converted web page. We support all the major chart types and features.
Note that some chart types are available only in the Professional edition.
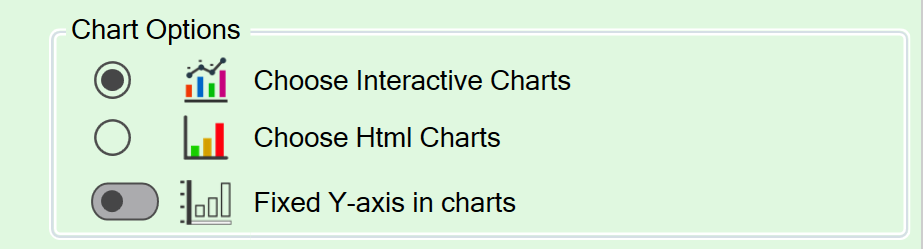
The Chart options are located on the Workbook tab of the task pane.
The Choose HTML Charts option may remain in effect for spreadsheets most recently converted with older versions of SpreadsheetConverter. To switch to interactive charts, just select Choose Interactive Charts.
To see the effect of changing these settings, convert the spreadsheet again.
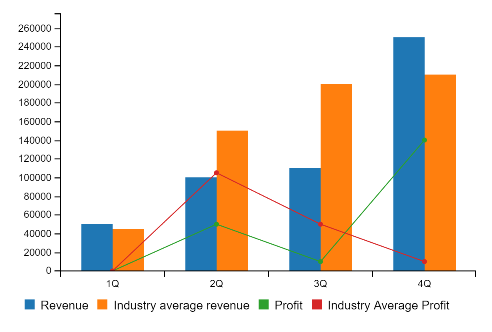
The interactive charts allow you to highlight one of the series just by hovering your mouse above its label.
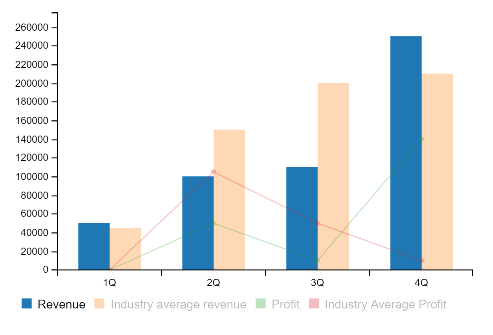
In the screenshot below, we just held the mouse pointer above the Revenue series’ label. As you can see, the other three series faded out to let you focus on the highlighted series.
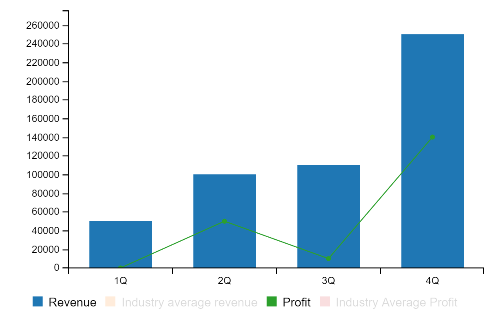
If you find some of the series distracting, just click once on the series labels and the series will be hidden. In the chart below, we simply clicked on the Industry average revenue and Industry Average Profit labels to hide them. Click on each label again to make the series visible.
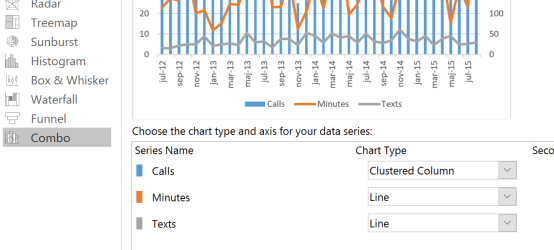
If you want to try this for yourself, create a Combo chart in Excel. In Excel 2016, it is at the bottom of the All charts tab.
You can also download our example spreadsheet just to see how charts can look in converted web pages.
Test an example of interactive charts
Download the example spreadsheet
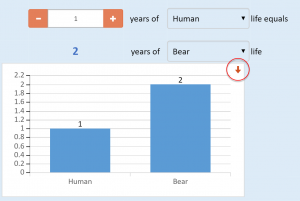
Interactive charts contain a convenient download link that allows you to save the chart as an image file.
Some of our tutorials partly focus on interactive charts: